Create a chart.
To the right of the data
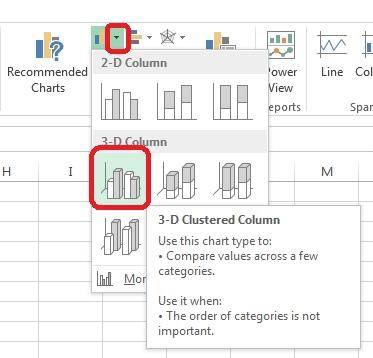
Chart 3-D Clustered Column
Exclude all filtered rows
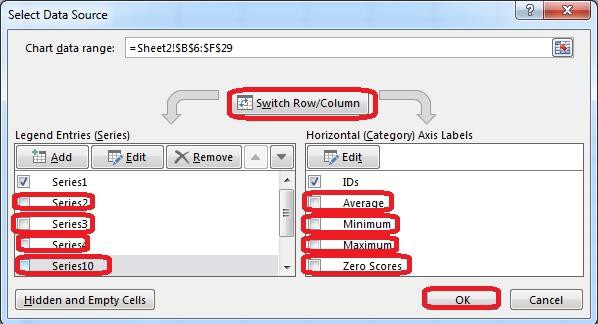
Horizontal Axis Labels: "IDs" column in table
Series 1: "Zero Scores" column in table.
Correct Answer: Use the following steps to complete this task in explanation:
Explanation/Reference:
Explanation:
Step 1: Click in a cell in the data table, and then click on the INSERT tab. b

Step 2: Click Insert Column Chart, and select 3-D Clustered Column.
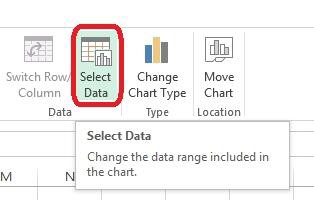
Step 3: If necessary move the chart to the right of the table.
Step 4: Click the Select Data button.
Step 5: In the Select Data Source dialog box click the Switch Row/Column button, Deselect everything except IDs for Horizontal Axis Labels, deselect everything excepts Series1 for Legend Entries (series), and click OK.