Home » Microsoft » MB-500 » DRAG DROP
DRAG DROP
You are a Dynamics 365 Finance developer.
The sales department manager must to be able to view total customers by region and total sales by regions.
You need to build key performance indicators (KPIs) and display them on a tile in the application.
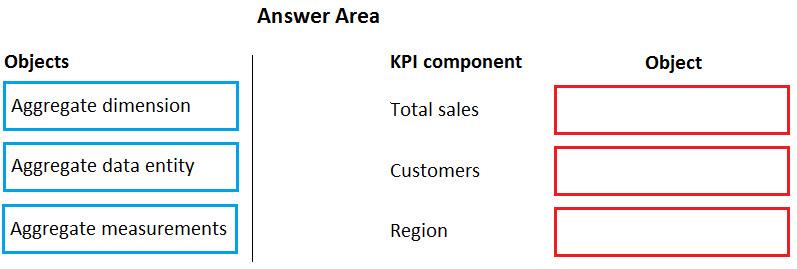
How should you model the KPI? To answer, drag the appropriate objects to the correct KPI components. Each object may be used once, more than once, or not at all. You may need to drag the split bar between panes or scroll to view content.
NOTE: Each correct selection is worth one point.
Select and Place:
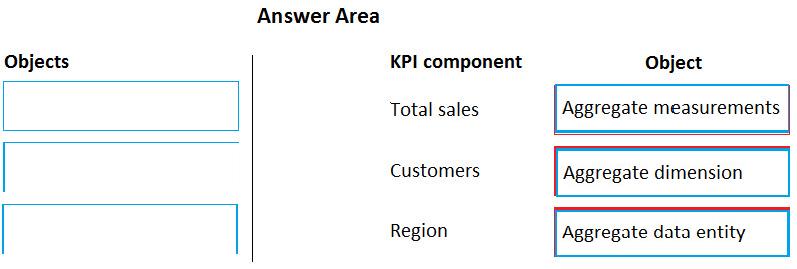
Correct Answer:
Explanation/Reference:
Explanation:
Box 1: Aggregate measurements Measures are aggregate numbers, such as Total Sales or Number of Orders.
Box 2: Aggregate dimension Dimensions are slicers, such as Product, Vendor, or Customer, that help you analyze the measure.
Box 3: Aggregate date entity By using the model-driven approach, you can create data entities by directly referencing aggregate measurements and aggregate dimensions. These are known as aggregate data entities. Aggregate data entities are read-only data entities that are used for reporting purposes. To consume aggregate data when you build charts and other client controls, add the aggregate data to a form as a data source.
Reference:
https://docs.microsoft.com/en-us/dynamics365/fin-ops-core/dev-itpro/analytics/analytics
