HOTSPOT
You are profiling data by using Power Query Editor.
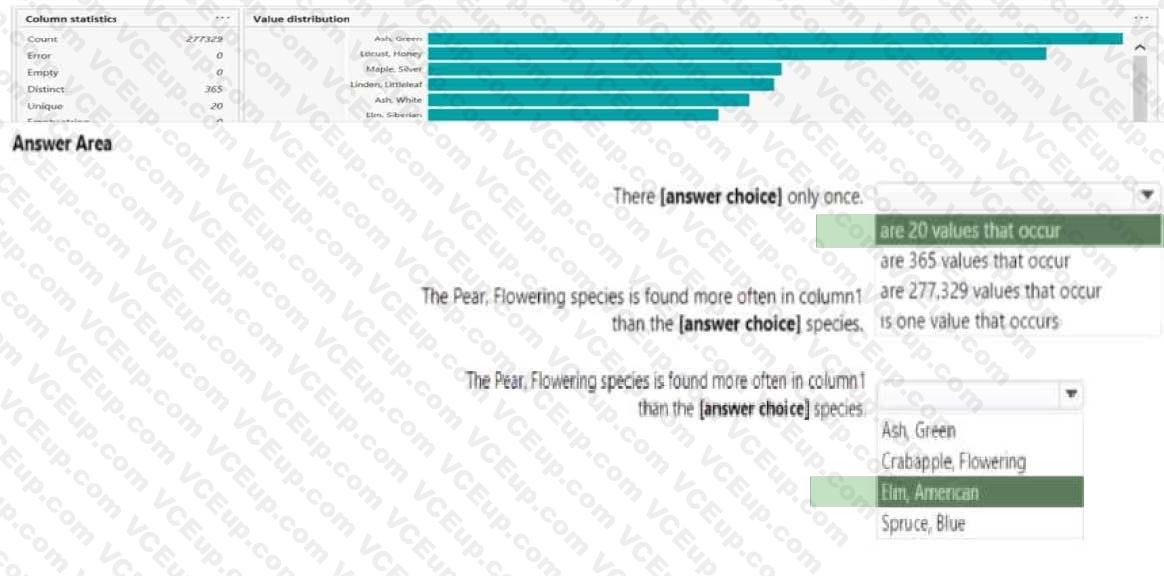
You have a table that contains a column named column1. Column statistics and Value distribution for column1 are shown in the following exhibit.
Hot Area:


HOTSPOT
You are profiling data by using Power Query Editor.
You have a table that contains a column named column1. Column statistics and Value distribution for column1 are shown in the following exhibit.
Hot Area: