HOTSPOT
Your company has affiliates who help the company acquire customers.
You build a report for the affiliate managers at the company to assist them in understanding affiliate performance.
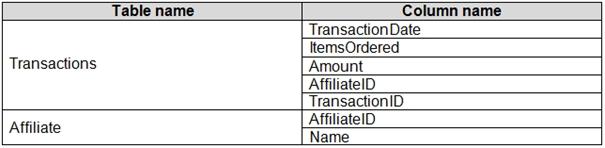
The managers request a visual showing the total sales value of the latest 50 transactions for each affiliate. You have a data model that contains the following tables.
The Affiliate table has a one-to-many relationship to the Transactions table based on the AffiliateID column.
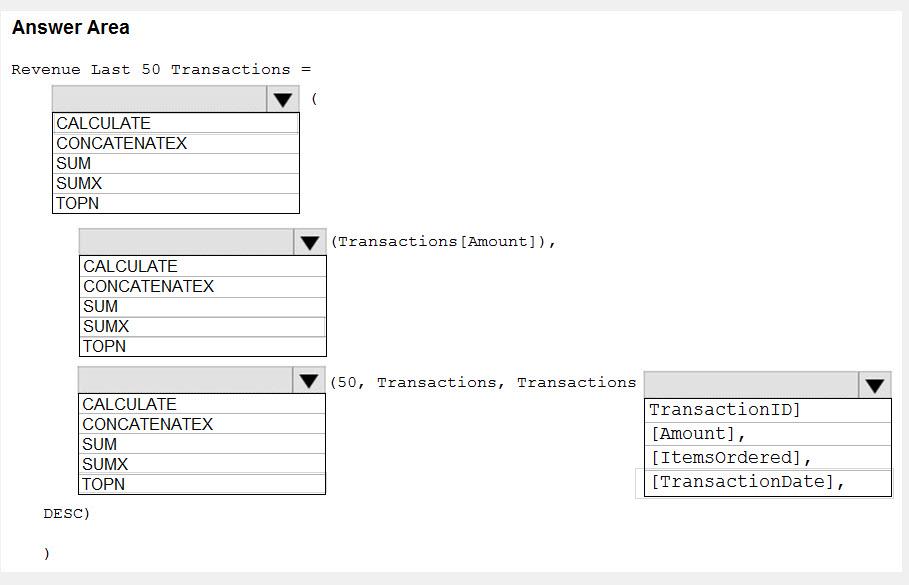
You need to develop a measure to support the visual.
How should you complete the DAX expression? To answer, select the appropriate options in the answer area.
NOTE: Each correct selection is worth one point.
Hot Area:
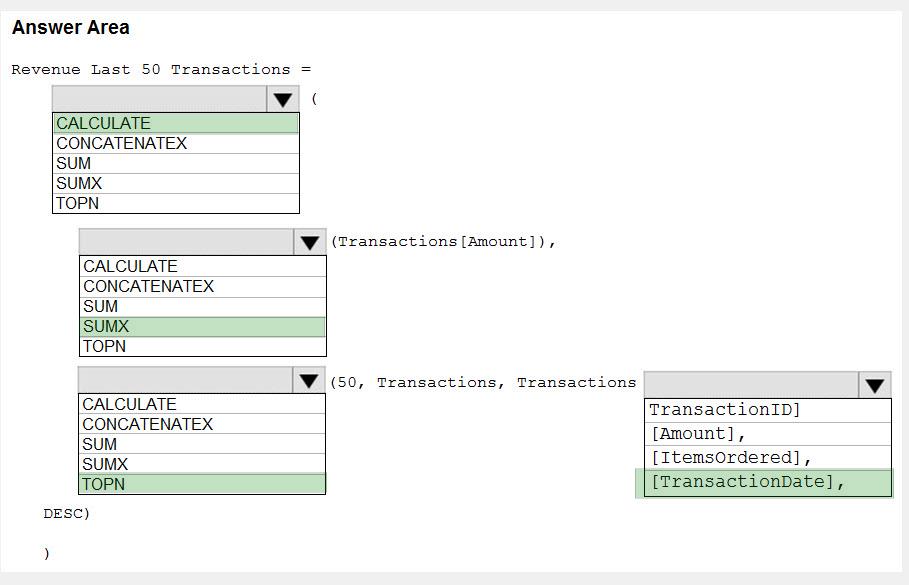
Correct Answer:
Explanation/Reference: Explanation: Box 1: CALCULATE Start with CALCULATE and use a SUMX. CALCULATE evaluates an expression in a modified filter context. Box 2: SUMX SUMX returns the sum of an expression evaluated for each row in a table. The following sample creates a measure with the sales of the top 10 sold products. = SUMX(TOPN(10, SUMMARIZE(Product, [ProductKey], “TotalSales”, SUMX(RELATED(InternetSales_USD[SalesAmount_USD]), InternetSales_USD[SalesAmount_USD]) + SUMX(RELATED(ResellerSales_USD[SalesAmount_USD]), ResellerSales_USD[SalesAmount_USD])) Box 3: TOPN TOPN returns the top N rows of the specified table. Box 4: [TransactionDate] TOPN Syntax: TOPN(,
, , [[, , []]…]) The orderBy_expression: Any DAX expression where the result value is used to sort the table and it is evaluated for each row of table. Reference: https://docs.microsoft.com/en-us/dax/topn-function-dax