You have a Power Bl report that contains the visual shown in the following exhibit.
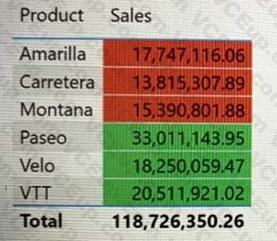
You need to make the visual more accessible to users who have color vision deficiency. What should you do?
A. Change the font color of values in the Sales column to white.
B. Change the red background color to orange.
C. Add icons to represent the sales status of each product.
D. Add additional measures to the table values.

C