You have a table named Sales. A sample of the data in Sales is shown in the following table.
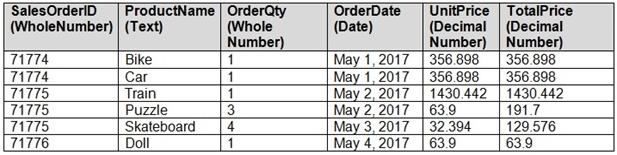
You create a stacked column chart visualization that displays ProductName by Date.
You discover that the axis for the visualization displays all the individual dates.
You need to ensure that the visualization displays ProductName by year and that you can drill down to see ProductName by week and day.
What should you do first?
A. Create a new table that has columns for the date, year, week, and day.
B. Create a new hierarchy in the Sales table.
C. Format the visualization and set the type of the X-Axis to Categorical.
D. Configure a visual filter for the Date column that uses an advanced filter.
