Correct Answer:
Explanation/Reference:
Explanation:
http://technet.microsoft.com/en-us/library/hh546551.aspx
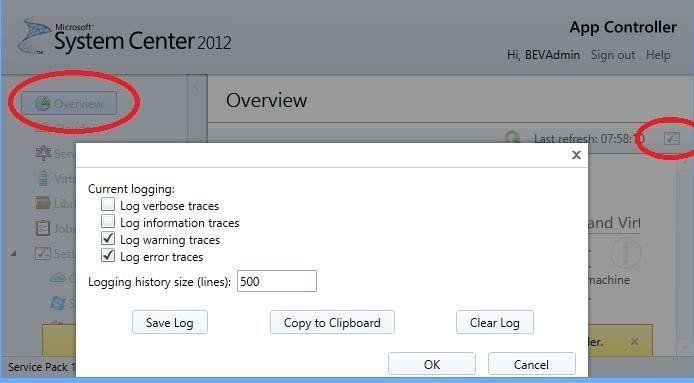
If you a signed in as an Administrator you can also access the logging options by clicking on the icon next to the last refresh time in the toolbar of the Overview page.
Configuring Collection of Diagnostic Information
By default, the client will only record errors and warnings up to 500 entries. You can increase or decrease theamount diagnostic information recorded, along with how much history is kept, in the logging options window.
To access the logging options, press CTRL+ALT+SHIFT+L.
If you a signed in as an Administrator you can also access the logging options by clicking on the icon next tothe last refresh time in the toolbar of the Overview page.
To increase or decrease the types of information recorded, check or clear the boxes on this screen.
To increase or decrease the amount of information recorded, specify the number of lines of information to berecorded. Increasing the number of lines will increase the memory used by the client.
Saving and Viewing Diagnostic Information
To save or view the diagnostic information, open the logging options window. To access the logging options,press CTRL+ALT+SHIFT+L.
If you a signed in as an Administrator you can also access the logging options by clicking on the icon next tothe last refresh time in the toolbar of the Overview page.
On this page you can choose to copy the log to the clipboard or save the diagnostics to a file. If you copy thediagnostics to the clipboard, you can paste the information into an application such as Notepad to view, or intoan e-mail to send to your support engineer.