Correct Answer:
Explanation/Reference:
Explanation:
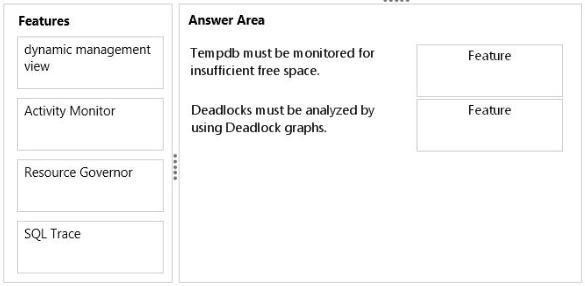
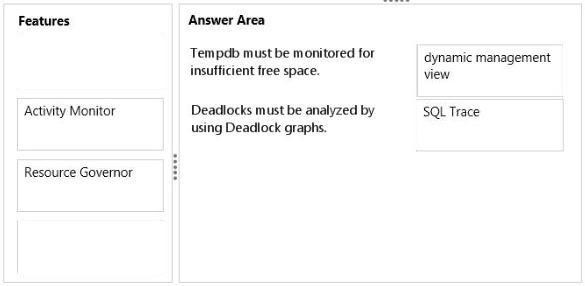
* You can use the sys.dm_db_file_space_usage dynamic management view to monitor the disk space used by the user objects, internal objects, and version stores in the tempdb files. Additionally, to monitor the page allocation or deallocation activity in tempdb at the session or task level, you can use the sys.dm_db_session_space_usage and sys.dm_db_task_space_usage dynamic management views. These views can be used to identify large queries, temporary tables, or table variables that are using a large amount of tempdb disk space.
*
/ Use SQL Server Profiler to identify the cause of a deadlock. A deadlock occurs when there is a cyclic dependency between two or more threads, or processes, for some set of resources within SQL Server. Using SQL Server Profiler, you can create a trace that records, replays, and displays deadlock events for analysis.
/ SQL Server Profiler and SQL Server Management Studio use a deadlock wait-for graph to describe a deadlock. The deadlock wait-for graph contains process nodes, resource nodes, and edges representing the relationships between the processes and the resources.
Reference: Troubleshooting Insufficient Disk Space in tempdb
Reference: Analyze Deadlocks with SQL Server Profiler