Home » Microsoft » 77-727 » Which shows the amounts and variety of products sold during the season.
SIMULATION
You are the Director of a local farmers’ market. You are creating and modifying charts for a report which shows the amounts and variety of products sold during the season.

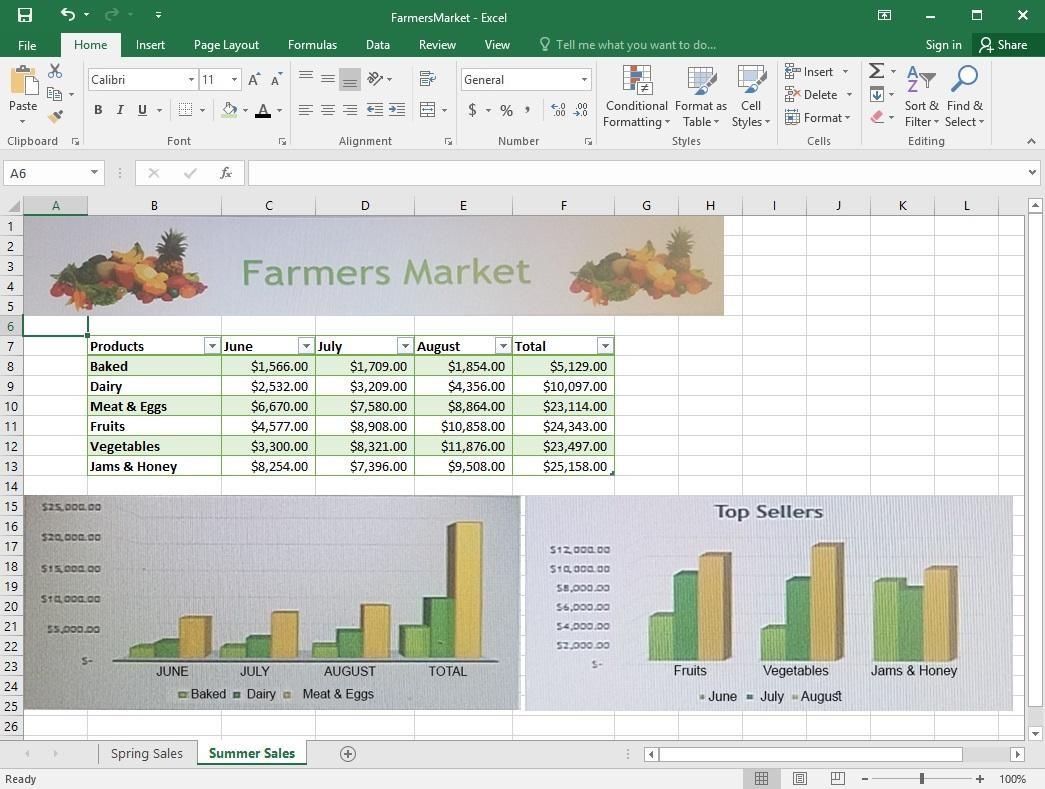
On the “Summer Sales” worksheet, add the “Total” data series to the “Top Sellers” column chart. Include the total only for “Fruits”, “Vegetables”, and “Jams & Honey”.
Correct Answer: See explanation below.
Explanation/Reference:
Explanation:
1. Select the “Top Sellers” column chart.
2. Click on the particular data point you want to label, click Add Chart Element +, from the upper right corner next to the chart, then select Data Labels.
3. Then click Format Data Labels.
4. The Data Label Range dialog box would appear, select the data range which are the cell values you want to appear in the labels, in this case it would be the “Total” colunn for “Fruits”, “Vegetables”, and “Jams & Honey”, then click OK.
References: https://support.office.com/en-us/article/add-or-remove-data-labels-in-a-chart-884bf2f1-2e29-454e-8b42-f467c9f4eb2d
