Home » Microsoft » 77-727 » Which shows the amounts and variety of products sold during the season.
SIMULATION
Overview
You are the Director of a local farmers’ market. You are creating and modifying charts for a report which shows the amounts and variety of products sold during the season.
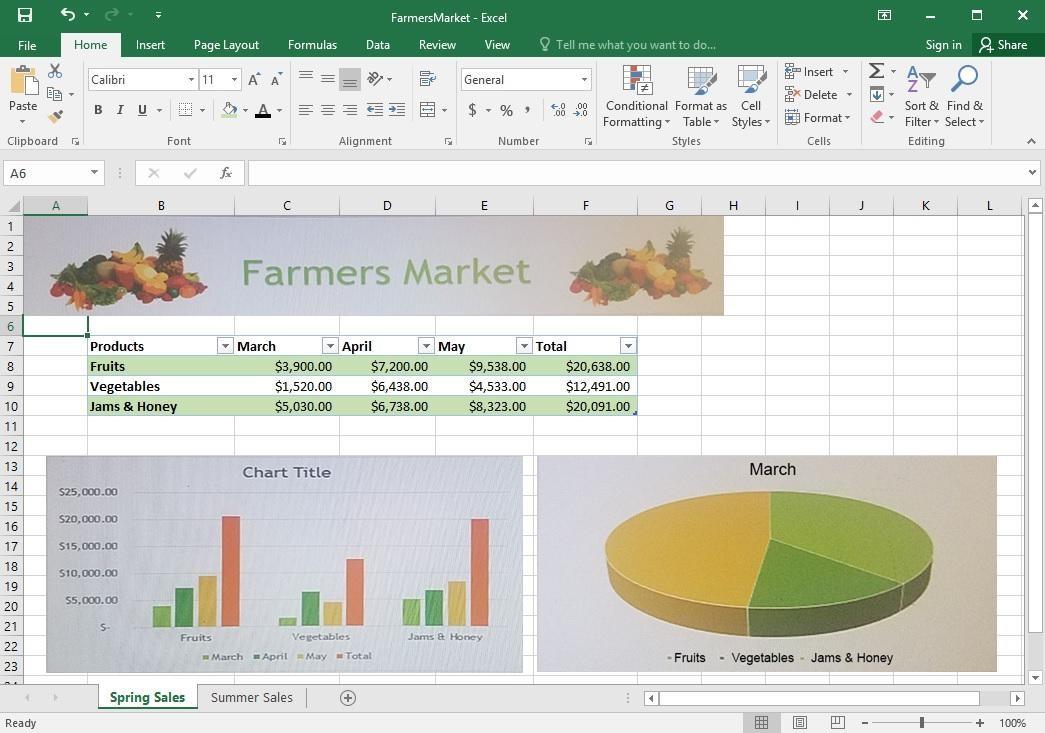
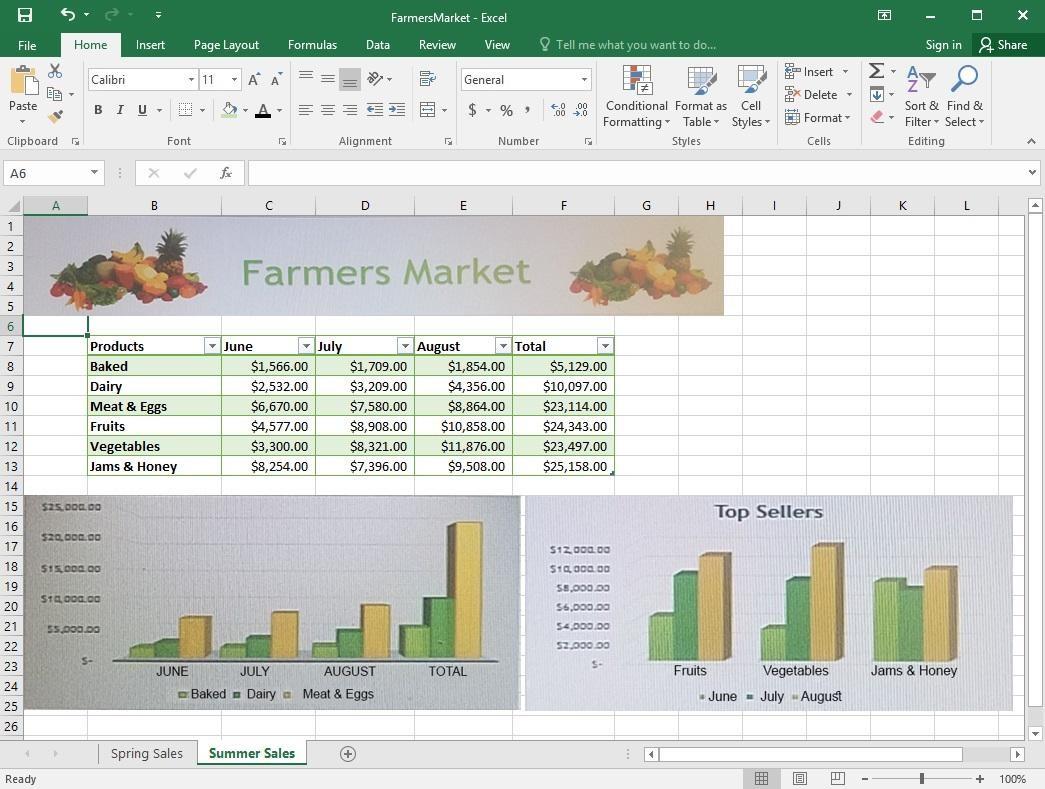
On the “Summer Sales” worksheet, use the data in the “Products” and “Total” columns only to create a 3-D Pie chart. Position the new chart to the right of the column charts.
Correct Answer: See explanation below.
Explanation/Reference:
Explanation:
1. Select the data you would like to use, in this case it would be the data in the “Products” and “Total” columns from the “Summer Sales” worksheet.
2. Click on Insert Pie Chart situation on the Insert tab then pick the 3-D Pie chart as desired.
3. Format the chart as desired by using Chart Elements, the Chart Styles, or the Chart Filters.
4. Drag the Pie Chart to the desired location which is to the right of the column charts.
References: https://support.office.com/en-us/article/Add-a-pie-chart-1A5F08AE-BA40-46F2-9ED0-FF84873B7863
