Home » Microsoft » DA-100 v.2 » Which type of visualization should you use?
HOTSPOT
You have a report page that contains the visuals shown in the following exhibit.
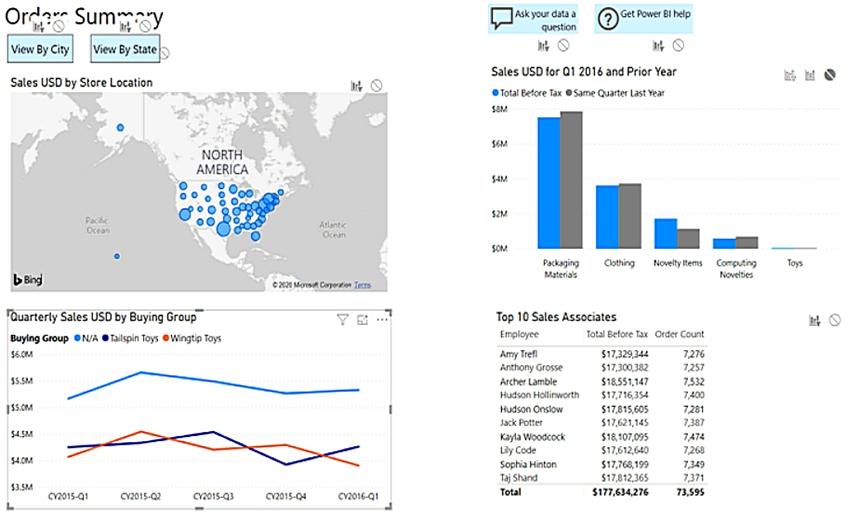
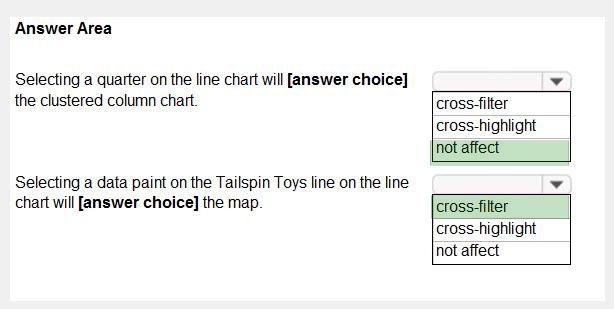
Use the drop-down menus to select the answer choice that completes each statement based on the information presented in the graphic.
NOTE: Each correct selection is worth one point.
Hot Area:

Correct Answer:
Explanation/Reference:
Box 1: not affect
The column chart has the no impact icon highlighted, thus selecting data points on the line graph will have no affect on the column chart.
Box 2: cross-filter
The map has the cross-filter icon highlighted, thus selecting data points on the line graph will be cross filtered onto the map.
Reference:
https://docs.microsoft.com/en-us/power-bi/create-reports/service-reports-visual-interactions
https://docs.microsoft.com/en-us/power-bi/consumer/end-user-interactions
