Home » Microsoft » AI-900 » You have the Predicted vs. True chart shown in the following exhibit.
You have the Predicted vs. True chart shown in the following exhibit.
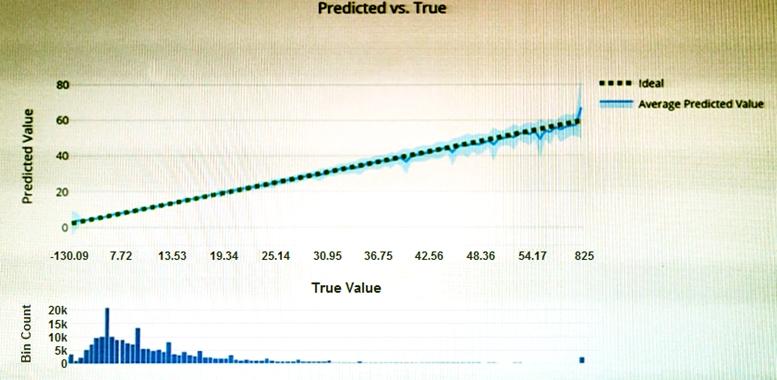
Which type of model is the chart used to evaluate?
A. classification
B. regression
C. clustering
Correct Answer: B
Explanation/Reference:
What is a Predicted vs. True chart?
Predicted vs. True shows the relationship between a predicted value and its correlating true value for a regression problem. This graph can be used to measure performance of a model as the closer to the y=x line the predicted values are, the better the accuracy of a predictive model.
Reference:
https://docs.microsoft.com/en-us/azure/machine-learning/how-to-understand-automated-m
