Users report that an app is slow to load. You navigate to the start page for the app in Internet Explorer and then open the Developer Tools window. You need to debug the JavaScript code.
Which five actions should you perform in sequence? (To answer, move the appropriate actions from the list of actions to the answer area and arrange them in the correct order.)
Select and Place:
Correct Answer:

Explanation/Reference:
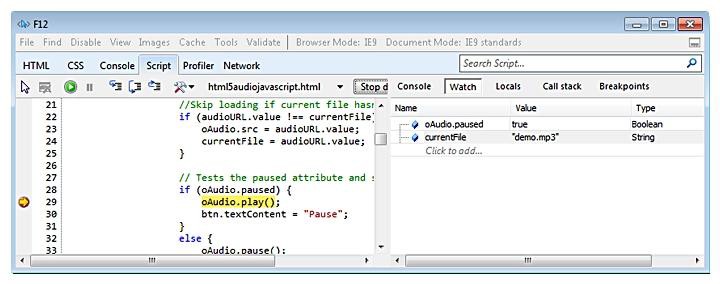
In the Script tab, you see the source pane on the left, where you can view your JavaScript code, set breakpoints, and step through the execution path of your functions. In the right pane, you can switch between the console, watch variables, local variables, watch stack, and breakpoint tabs.
Reference: Using the F12 Developer Tools to Debug JavaScript Errors
Note: Developer Tools have new look and feel in IE11

