DRAG DROP
You plan to explore demographic data for home ownership in various cities. The data is in a CSV file with the following format:
age,city,income,home_owner
21,Chicago,50000,0
35,Seattle,120000,1
23,Seattle,65000,0
45,Seattle,130000,1
18,Chicago,48000,0
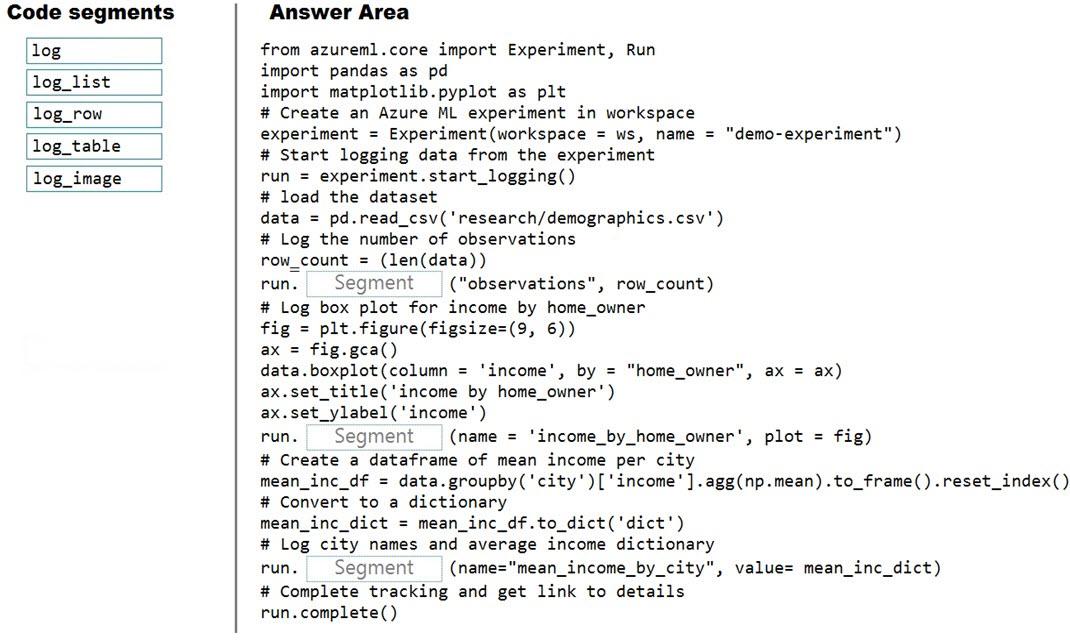
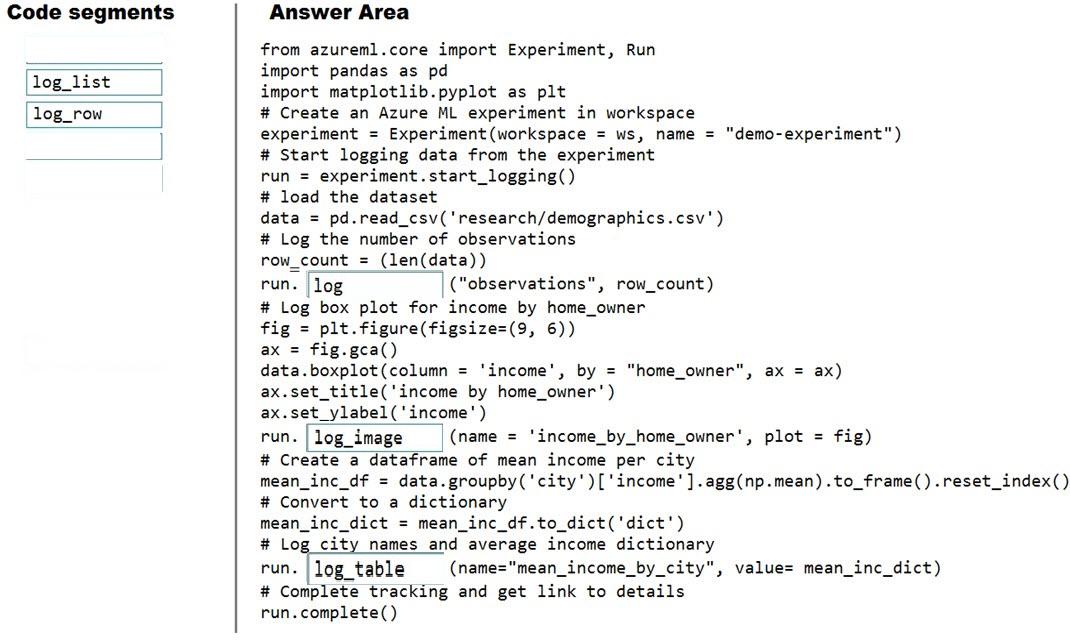
You need to run an experiment in your Azure Machine Learning workspace to explore the data and log the results. The experiment must log the following information:
the number of observations in the dataset a box plot of income by home_owner a dictionary containing the city names and the average income for each city You need to use the appropriate logging methods of the experiment’s run object to log the required information.
How should you complete the code? To answer, drag the appropriate code segments to the correct locations. Each code segment may be used once, more than once, or not at all. You may need to drag the split bar between panes or scroll to view content.
NOTE: Each correct selection is worth one point.
Select and Place: