In Report Studio, an author creates the following report:
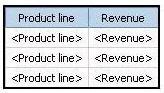
The author wants each row of this report to contain a column chart displaying quantity sold for a particular product line. How can the author ensure that the chart in each row displays data for only the product line that appears in the same row?
A. Add a column chart to the list, link the column chart to the same query used for the list and then add data to the chart.
B. Add a column chart to the list, add data to the chart and then create a union relationship between the queries for the list and the chart.
C. Add a column chart to the list, add data to the chart and then create an intersect relationship between the queries for the list and the chart.
D. Add a column chart to the list, add data to the chart and then create a master-detail relationship between the queries for the list and the chart.
|
Download Printable PDF. VALID exam to help you PASS. |
 |