You open a Power Bl Desktop report that contains an imported data model and a single report page.
You open Performance analyzer, start recording, and refresh the visuals on the page. The recording produces the results shown in the following exhibit
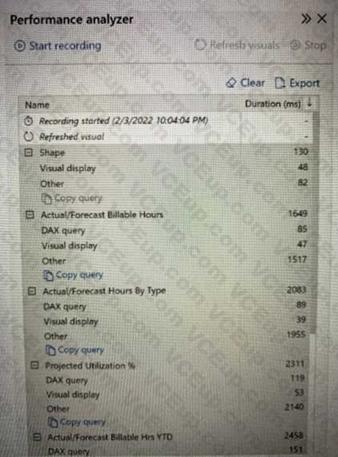
What can you identify from the results?
A. The Actual/Forecast Hours by Type visual takes a long time to render on the report page when the data is cross-filtered.
B. The Actual/Forecast Billable Hrs YTD visual displays the most data.
C. Unoptimized DAX queries cause the page to load slowly.
D. When all the visuals refresh simultaneously, the visuals spend most of the time waiting on other processes to finish.
