Home » Microsoft » PL-300 » What should you add to the visual?
You have the visual shown in the Original exhibit. {Click the Original tab.)

You need to configure the visual as shown in the Modified exhibit. (Click the Modified tab.)
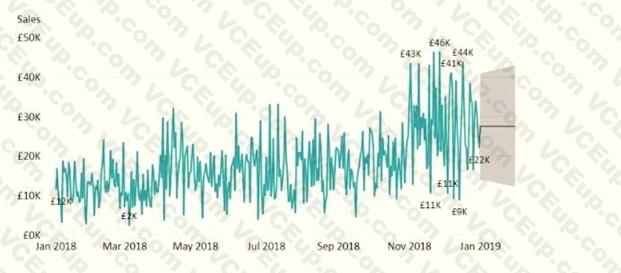
What should you add to the visual?
A. a measure
B. a trendline
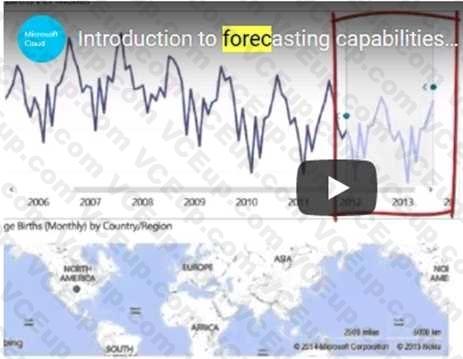
C. a forecast
D. an Average line
Correct Answer: C
Explanation/Reference:
Explanation:
Explore forecast results by adjusting the desired confidence interval or by adjusting outlier data to see how they affect results.
 Reference:
https://powerbi.microsoft.com/fr-fr/blog/introducing-new-forecasting-capabilities-in-power-viewfor-office-365/
Reference:
https://powerbi.microsoft.com/fr-fr/blog/introducing-new-forecasting-capabilities-in-power-viewfor-office-365/
