DRAG DROP
You create the PivotChart shown in the exhibit. (Click the Exhibit button.)
Exhibit:

In which area is Product and in which area is SalesAmount? To answer, drag the appropriate fields to the correct areas. Each field may be used once more than once, or not at all. You may need to drag the split bar between panes or scroll to view content.
NOTE: Each correct selection is worth one point.
Select and Place:

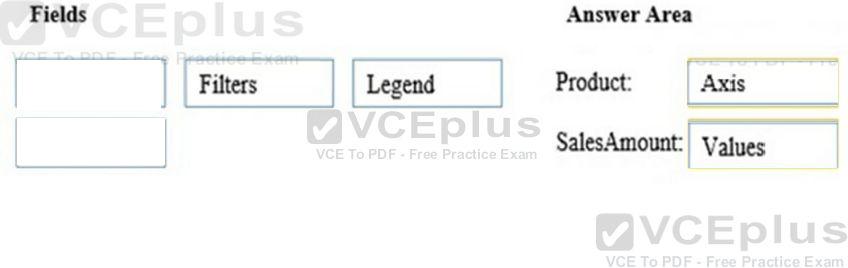

Axis and Values are the correct answer.
+
Legend
values
@Aaron is correct.
A legend defines the values. Like it defines each Product at the bottom of the chart.
The values are the actual metrics of the overall ratio. The slice within the pie.
There is not Axis on this because it is a pie chart. Axis refer to a line or bar chart where X and Y are present.
Correct answer is Legend and Values.