You are creating a report in Power BI Desktop that has two visualizations on a page as shown in the following exhibit.
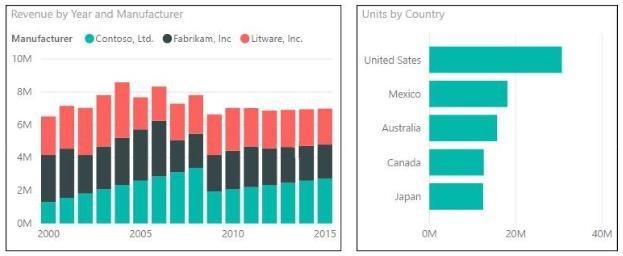
You need to ensure that when you click the bar of a country, only the values for that country are shown on the Revenue by Year and Manufacturer chart.
A. Click the Revenue by Year and Manufacturer chart. On the Format tab, click Edit Interactions. On the Units by Country chart, click Filter.
B. Click the Revenue by Year and Manufacturer chart. On the Format tab, click Edit Interactions. On the Units by Country chart, click Highlight.
C. Click the Units by Country chart. On the Format tab, click Edit Interactions. On the Revenue by Year and Manufacturer chart, click Filter.
D. Click the Units by Country chart. On the Format tab, click Edit Interactions. On the Revenue by Year and Manufacturer chart, click Highlight.
