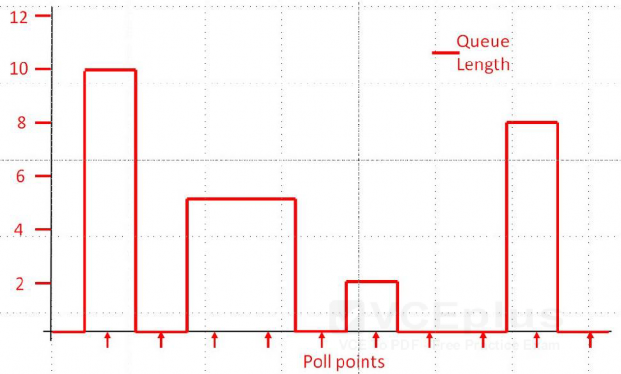
Refer to the exhibit.

A customer has a performance problem and is using Unisphere Analyzer to investigate the issue. They believe the problem is related to bursty data writes from the application. The Solutions Architect (SA), who is at the customer’s location, is asked to explain how values are calculated which could indicate this problem. The SA produces a graph, shown in the exhibit, to use in future presentations to customers.
Which ABQL value does the graph indicate?
A. 6.0
B. 10.0
C. 3.0
D. 5.0

