Home » Microsoft » AZ-400 v.2 » Which widget should you use for each metric?
DRAG DROP
You are configuring the Azure DevOps dashboard. The solution must meet the technical requirements.
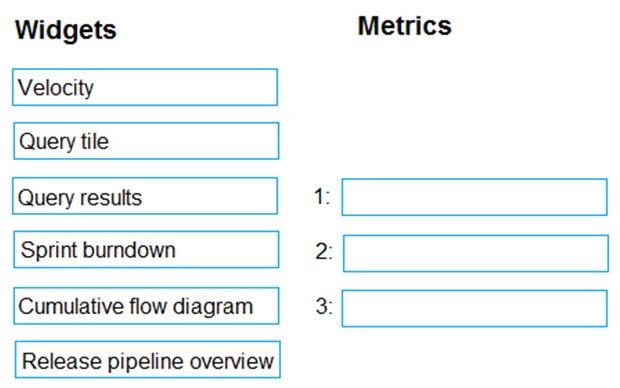
Which widget should you use for each metric? To answer, drag the appropriate widgets to the correct metrics. Each widget may be used once, more than once, or not at all. You may need to drag the split bar between panes or scroll to view content.
NOTE: Each correct selection is worth one point.
Select and Place:
Correct Answer:

Explanation/Reference:
Explanation:
Woodgrove Bank identifies the following technical requirements:
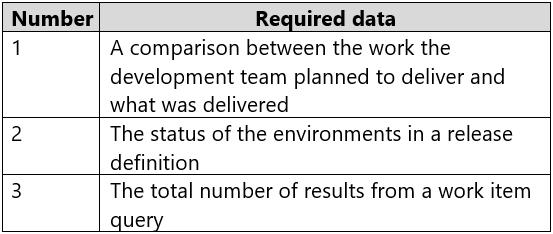 The Azure DevOps dashboard must display the metrics shown in the following table:
Box 1: Velocity
Velocity displays your team velocity. It shows what your team delivered as compared to plan.
Box 2: Release pipeline overview
Release pipeline overview shows the status of environments in a release definition.
Box 3: Query tile
Query tile displays the total number of results from a query.
Reference:
https://docs.microsoft.com/en-us/azure/devops/report/dashboards/widget-catalog?view=azure-devopsMix Questions
The Azure DevOps dashboard must display the metrics shown in the following table:
Box 1: Velocity
Velocity displays your team velocity. It shows what your team delivered as compared to plan.
Box 2: Release pipeline overview
Release pipeline overview shows the status of environments in a release definition.
Box 3: Query tile
Query tile displays the total number of results from a query.
Reference:
https://docs.microsoft.com/en-us/azure/devops/report/dashboards/widget-catalog?view=azure-devopsMix Questions

Velocity -A guide for determining how well the team estimates and meets their planned commitments
Query tile – Display total number of results for query
Query results – Display results from a query
Sprint burndown – report to determine if your team is on track to complete its sprint plan
Cumulative flow diagram – to monitor the flow of work through a system
Release pipeline overview – use to view and track the status of a release pipeline