Given the following sprint:
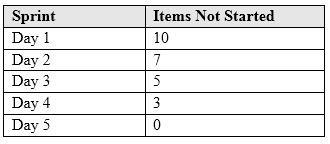
Which of the following charts BEST demonstrates the decreasing number of Not Started items for the sprint depicted above?
A. Gantt chart
B. Pareto chart
C. Scatter chart
D. Burndown chart

Given the following sprint:
Which of the following charts BEST demonstrates the decreasing number of Not Started items for the sprint depicted above?
A. Gantt chart
B. Pareto chart
C. Scatter chart
D. Burndown chart
100% D. burn down chart
D. Burndown chart